Insights Tool
The Insights Tool is intended to help a user explore the datasets provided by our oracle for any specified area of interest. Use it to get insights into the right datasets, metrics and thresholds to use in your smart contract for any given area.
Introduction
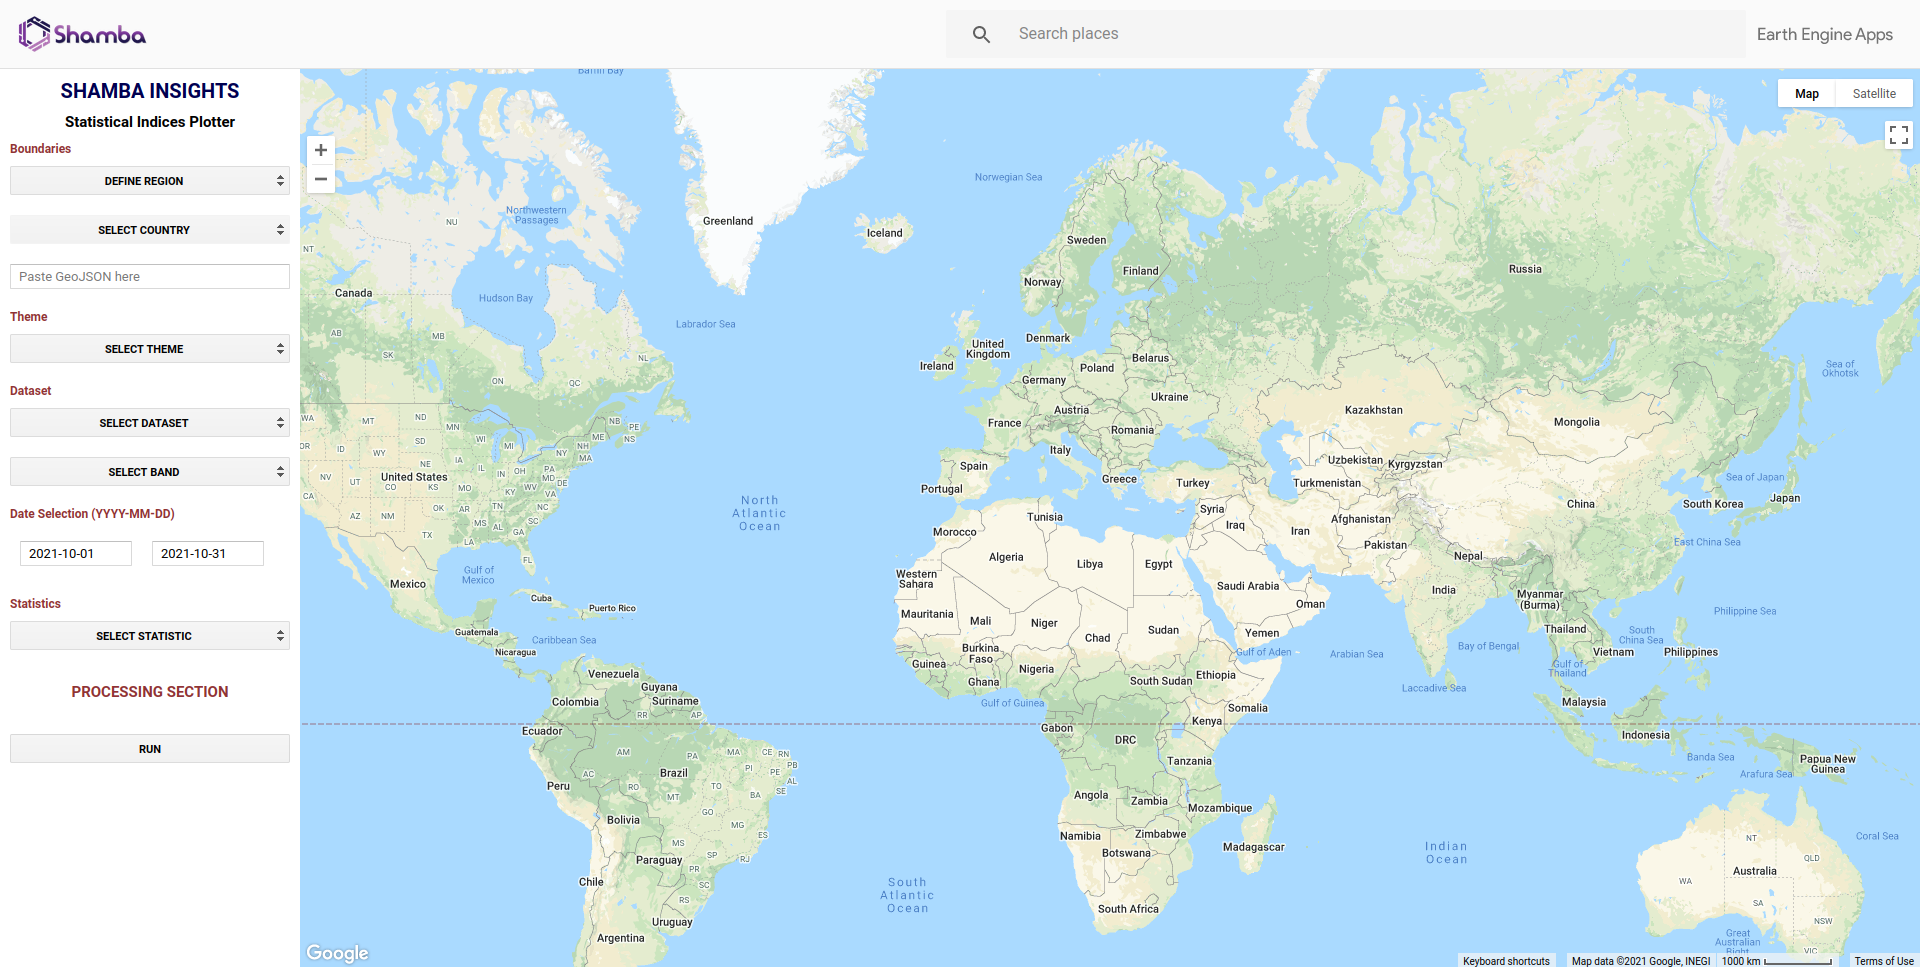
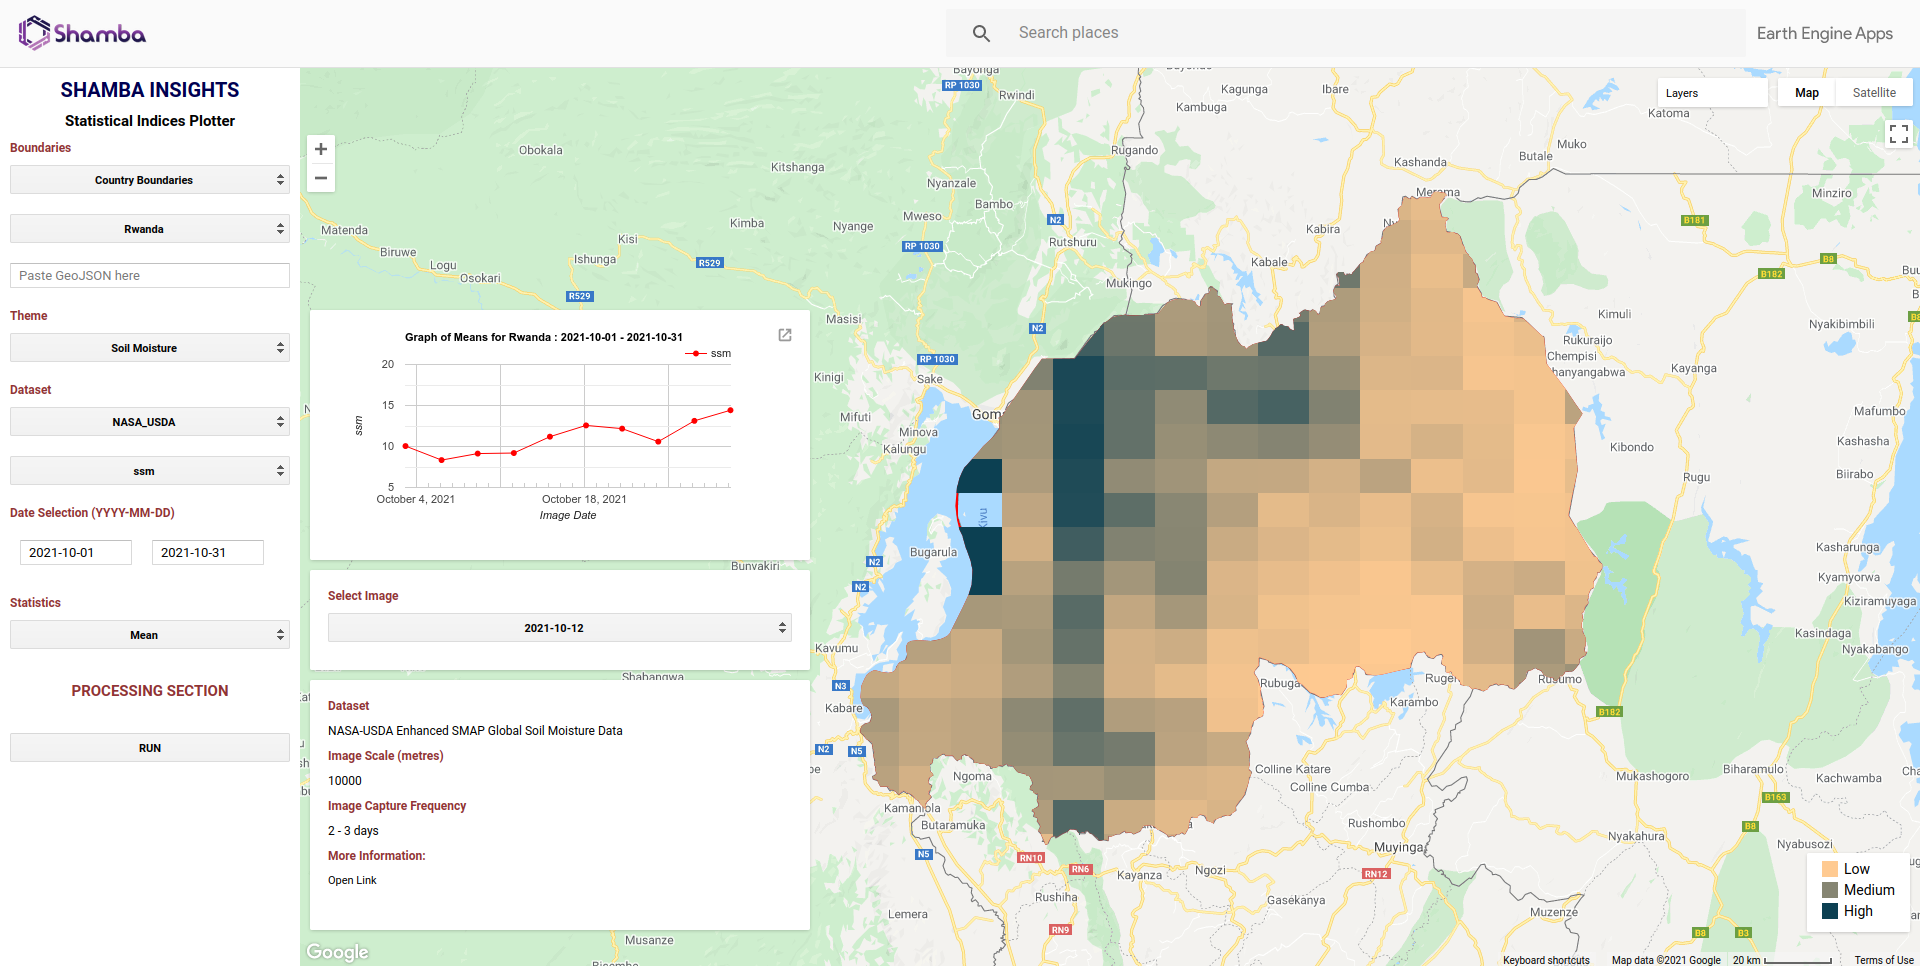
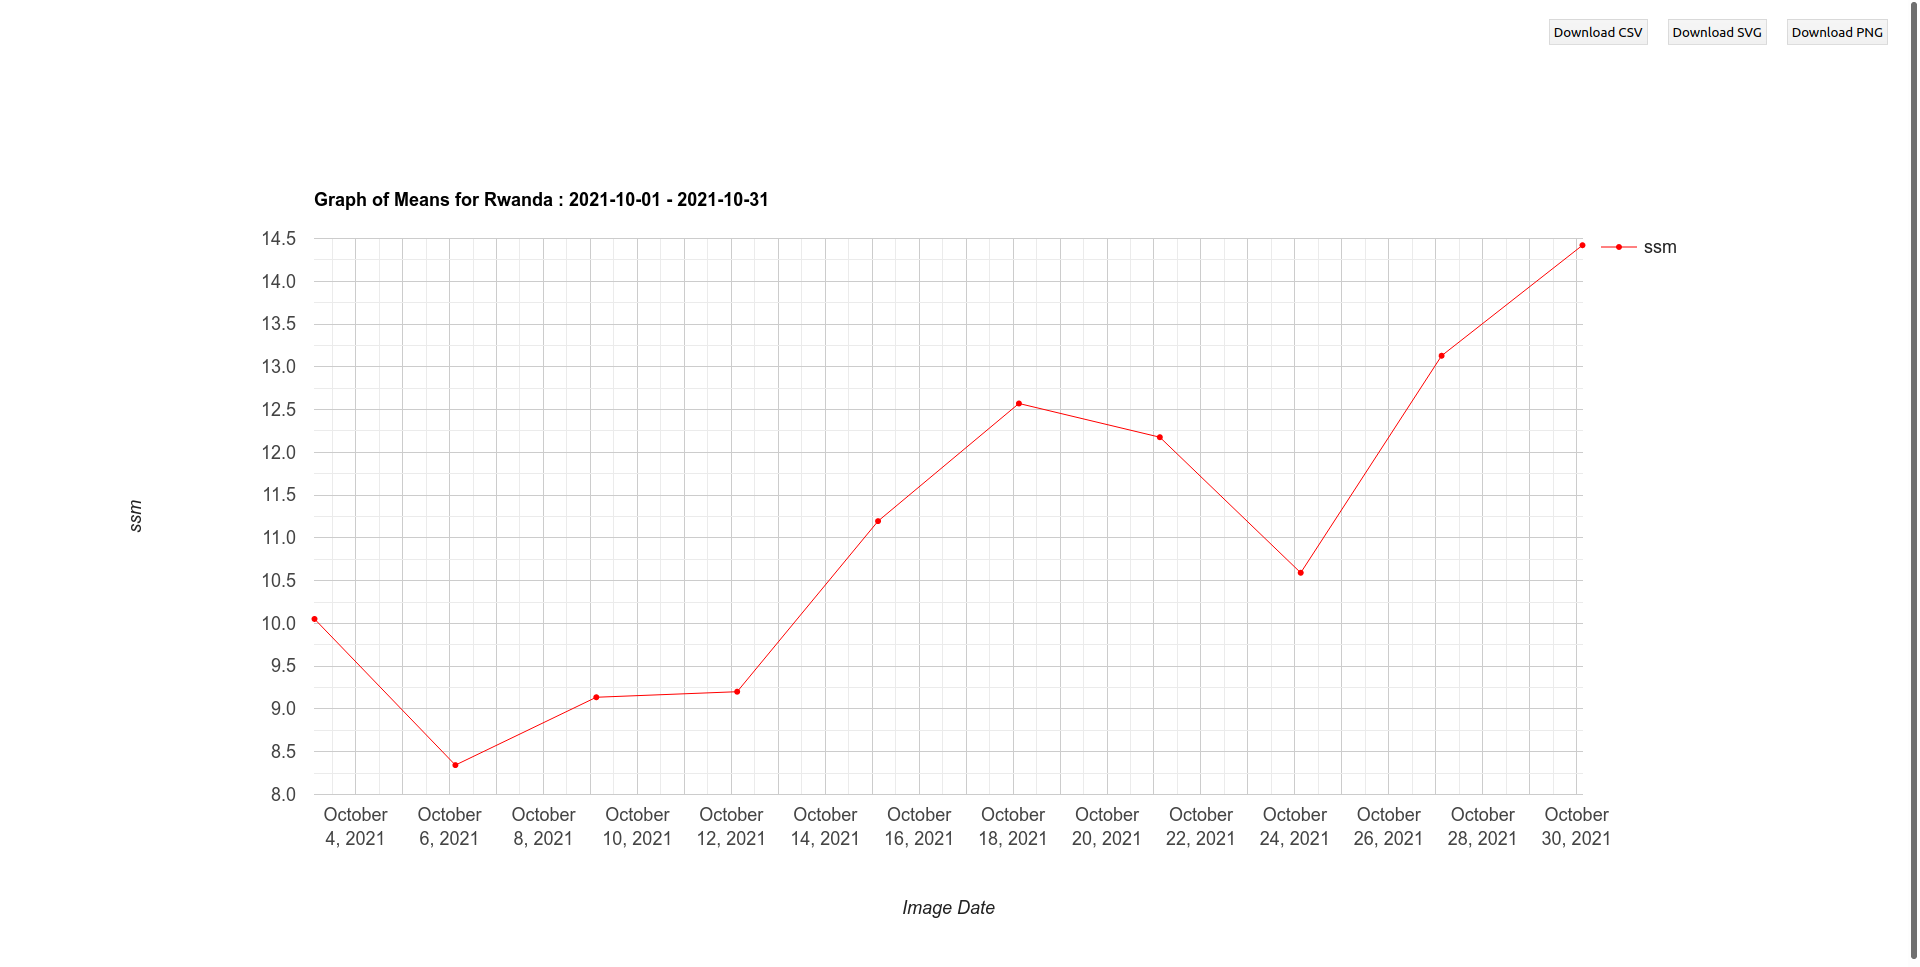
Below is an interface for the insights tool. Use the input panel on the right and explore results on the main panel. You can maximize the time series graphs and interact with them to get exact numbers for any point in time.

Landing page |

Data view |

Graph view |
Usage
Search for your area of interest on the search bar at the top.
Select ‘user-defined boundary’ on the input panel on the left.
Draw the area of interest using the tools on the map in the main panel.
Select the theme of interest e.g rainfall, vegetation etc.
Select the dataset you would like to explore within a theme.
Select the statistical metric of interest such as max, min, mean etc.
Select the time range over which you would like to explore the data.
Run the analysis and explore the time series insights through an interactive graph.
Select an image date to plot out the data on a map and explore the spatial insights.
Repeat the process with different metrics, datasets and durations to analyze your area.
In all cases, look for seasonal thresholds that define different environmental states.
State examples: wet vs dry season (precipitation), lush vs barren season (vegetation).
Define the dataset-metric-threshold combinations that characterize an area of interest.
Use these thresholds as parametric triggers in smart contracts for that area of interest.